Who has the worst MLB season of all time?

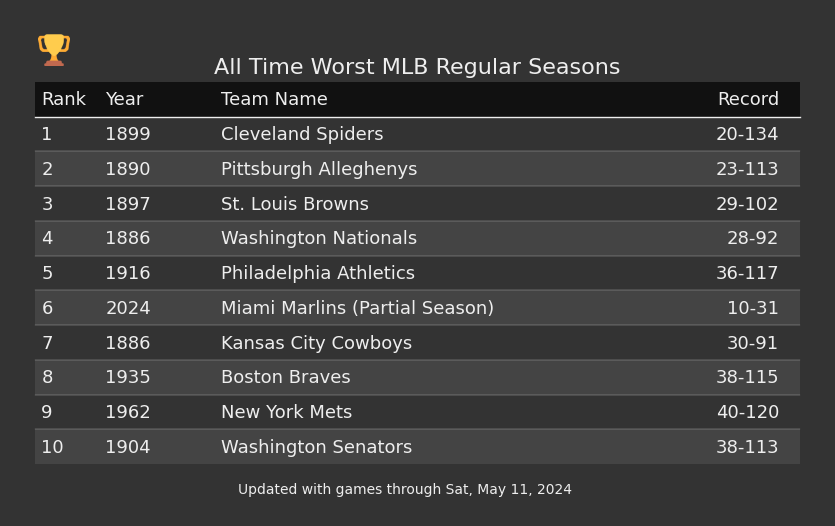
Based on winning percentage, the 1899 Cleveland Spiders had the worst MLB regular season in history at 20-134.

Who has the most losses in an MLB season?

The 1899 Cleveland Spiders have the record for most losses in an MLB season with 134 losses.

Who has the worst run differential of all time in an MLB season?

The 1899 Cleveland Spiders have the record for the worst run differential of all time, finishing the 1899 MLB season with a differential of -724 runs. In that season the Spiders scored 529 runs and allowed 1,253.

What is the worst record to make the MLB Postseason?

The worst teams by winning percentage to make the MLB postseason are the the 2020 Houston Astros who went 29-31, and the the 2020 Milwaukee Brewers who went 29-31.
Based on number of losses, the worst team to make the MLB postseason is the 2005 San Diego Padres, who made the postseason with a 82-80 record. The San Diego Padres lost to the St. Louis Cardinals in the NL Divisional Series.

Worst MLB Regular Season Records

Team Year Record
1 Cleveland Spiders  1899 20-134
2 Chicago White Sox  Partial Season 2024 3-15
3 Pittsburgh Alleghenys 1890 23-113
4 Colorado Rockies  Partial Season 2024 4-15
Miami Marlins  Partial Season 2024 4-15
6 St. Louis Browns 1897 29-102
7 Washington Nationals  1886 28-92
8 Philadelphia Athletics 1916 36-117
9 Kansas City Cowboys  1886 30-91
10 Boston Braves 1935 38-115
11 New York Mets 1962 40-120
12 Washington Senators 1904 38-113
13 Philadelphia Athletics 1919 36-104
14 St. Louis Browns 1898 39-111
15 Detroit Tigers 2003 43-119
16 Louisville Colonels  1895 35-96
17 Pittsburgh Pirates 1952 42-112
18 Washington Senators 1909 42-110
19 Louisville Colonels  1894 36-94
20 Philadelphia Phillies 1942 42-109
21 Boston Red Sox 1932 43-111
Philadelphia Phillies 1941 43-111
St. Louis Browns 1939 43-111
24 Philadelphia Athletics 1915 43-109
Philadelphia Phillies 1928 43-109
26 Louisville Colonels  1896 38-93
27 Baltimore Orioles 2018 47-115
28 Boston Rustlers 1911 44-107
29 Detroit Tigers 2019 47-114
30 Indianapolis Hoosiers  1887 37-89
31 Boston Doves 1909 45-108
32 St. Louis Browns 1911 45-107
33 St. Louis Browns 1895 39-92
34 Philadelphia Phillies 1939 45-106
35 Philadelphia Phillies 1945 46-108
St. Louis Browns 1937 46-108
37 Philadelphia Phillies 1938 45-105
38 Houston Astros  Partial Season 2024 6-14
39 Boston Red Sox 1926 46-107
40 Philadelphia Phillies 1961 47-107
St. Louis Browns 1910 47-107
42 St. Louis Browns 1896 40-90
43 New York Mets 1965 50-112
Oakland Athletics 2023 50-112
45 Boston Red Sox 1925 47-105
46 Washington Senators  1893 40-89
47 Philadelphia Athletics 1920 48-106
48 Baltimore Orioles  1892 46-101
49 St. Louis Cardinals 1903 43-94
Washington Senators 1903 43-94
Team Year Record
1 Cleveland Spiders  1899 20-134
2 New York Mets 1962 40-120
3 Detroit Tigers 2003 43-119
4 Philadelphia Athletics 1916 36-117
5 Boston Braves 1935 38-115
Baltimore Orioles 2018 47-115
7 Detroit Tigers 2019 47-114
8 Pittsburgh Alleghenys 1890 23-113
Washington Senators 1904 38-113
10 Pittsburgh Pirates 1952 42-112
Oakland Athletics 2023 50-112
New York Mets 1965 50-112
13 St. Louis Browns 1898 39-111
Philadelphia Phillies 1941 43-111
St. Louis Browns 1939 43-111
Boston Red Sox 1932 43-111
Houston Astros 2013 51-111
Arizona Diamondbacks 2004 51-111
New York Mets 1963 51-111
20 Washington Senators 1909 42-110
Arizona Diamondbacks 2021 52-110
Baltimore Orioles 2021 52-110
Montreal Expos 1969 52-110
San Diego Padres 1969 52-110
25 Philadelphia Phillies 1942 42-109
Philadelphia Phillies 1928 43-109
Philadelphia Athletics 1915 43-109
Detroit Tigers 1996 53-109
Toronto Blue Jays 1979 53-109
New York Mets 1964 53-109
31 Boston Doves 1909 45-108
Philadelphia Phillies 1945 46-108
St. Louis Browns 1937 46-108
Baltimore Orioles 2019 54-108
Florida Marlins 1998 54-108
Oakland Athletics 1979 54-108
37 Boston Rustlers 1911 44-107
St. Louis Browns 1911 45-107
Boston Red Sox 1926 46-107
Philadelphia Phillies 1961 47-107
St. Louis Browns 1910 47-107
Baltimore Orioles 1988 54-107
Toronto Blue Jays 1977 54-107
Washington Nationals 2022 55-107
Houston Astros 2012 55-107
Montreal Expos 1976 55-107
47 Philadelphia Phillies 1939 45-106
Philadelphia Athletics 1920 48-106
Atlanta Braves 1988 54-106
Detroit Tigers 2002 55-106
Tampa Bay Devil Rays 2002 55-106
Kansas City Royals 2023 56-106
Houston Astros 2011 56-106
Kansas City Royals 2005 56-106
Milwaukee Brewers 2002 56-106
Chicago White Sox 1970 56-106
Washington Senators 1963 56-106

Longest Championship Drought By City

Most Championships By City

Frequently Asked Questions

How Scoring Works

Accuracy and Fact Checking

All MLB stats, streaks, droughts and records are updated based on games played on or before Apr 18, 2024.

Copyright © 2015-2024 ChampsOrChumps.us
TermsPrivacy PolicyAbout