How Scoring Works
Earning Points
Champ points are awarded based on postseason success in the big four sports. The majority of points are earned on the basis of championships, but other deep runs into the playoffs are also rewarded. Champ points fade away over time, so the Champ Score is a measure of recent success.
The most recent winner of a championship in any of the big four sports is awarded 1 champ point. The winner of the MLS and WNBA seasons earns 1/3rd of a champ point. Here are the winning cities from the past season:
| League | Year | Most Recent Champion | Points Earned |
|---|---|---|---|
| MLB | 2023 | Dallas | 1.00 |
| MLS | 2023 | Columbus | 0.33 |
| NBA | 2024 | Boston | 1.00 |
| NFL | 2023 | Kansas City | 1.00 |
| NHL | 2024 | Miami | 1.00 |
| WNBA | 2023 | Las Vegas | 0.33 |
Points are also allocated to the other teams which made the playoffs. We'll use the most recent MLB playoffs as an example:
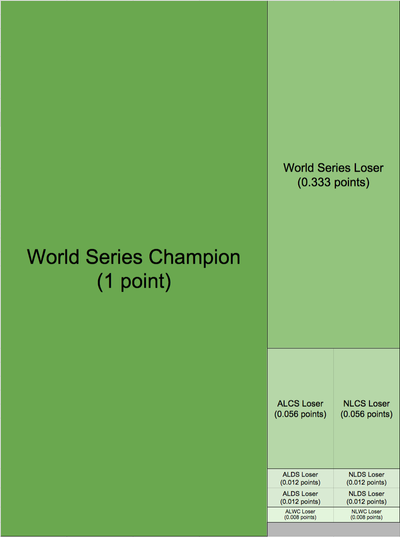
Starting from the championship and moving backwards, every group of losers gets ⅓ as many points as those whole made it to the next round. So if winning the championship is worth 1 point, the next "group" going backwards in the playoffs is the team that lost the World Series. They get ⅓ of what the World Series winner gets, or 0.33 points.
Then the next group of losers is awarded ⅓ of that, or 0.11 points. But now these points must be shared among the two teams that lost in the final 4, the ALCS loser and the NLCS loser. So each of these teams splits the 0.11 points, receiving 0.056 points each. Then so on for all the previous rounds of the playoffs.
Below is a visual representation of the scoring, along with a chart of the exact points awarded during the last completed MLB Season. You'll notice a large drop-off in points awarded for short playoff appearances. The Champ Score is designed to reward championships and deep playoff runs. For this ranking, merely making the playoffs and being eliminated quickly is only slightly better than not making the playoffs at all.
| League | Year | Team | Final Position | Points Earned |
|---|---|---|---|---|
| MLB | 2023 | Dallas | 1 | 1.000 |
| MLB | 2023 | Phoenix | 2 | 0.333 |
| MLB | 2023 | Houston | 4 | 0.056 |
| MLB | 2023 | Philadelphia | 4 | 0.056 |
| MLB | 2023 | Atlanta | 8 | 0.012 |
| MLB | 2023 | Baltimore | 8 | 0.012 |
| MLB | 2023 | Los Angeles | 8 | 0.012 |
| MLB | 2023 | Minneapolis | 8 | 0.012 |
| MLB | 2023 | Miami | 12 | 0.005 |
| MLB | 2023 | Milwaukee | 12 | 0.005 |
| MLB | 2023 | Tampa | 12 | 0.005 |
| MLB | 2023 | Toronto | 12 | 0.005 |
Points Decay Over Time
Over time, successful seasons because less and less relevant to today's Champ Score. Every year that passes, the score generated from a championship or deep playoff run is reduced until it eventually becomes 0. There are two decay formulas: a formula for championship points and a formula for non-championship points.
Both formulas are illustrated on the graph to the right (or below on small screens). In both graphs, you can see the value of the score go down as years elapse. For championships, this decay is both slower and longer lasting: a city still gets a small amount of points for a championship won 9 years ago. But for a non-championship playoff run, after 5 years those points will not count anymore ("nobody remembers second place").
This means that a city's Champ Score is based on only the last 10 years of playoff success. So current Champ Scores, are based on the 2015 - 2024 seasons. Historical scores are based on the same parameters: for example, New York's all-time maximum score, achieved in 1953, is based on the 1944-1953 seasons.